Quick Start
MarkDown 语法 链接地址
Arthas Guide 链接地址
Spring Boot 集成Arthas
集成的方法:spring boot 模块通过引入依赖 + 配置的方式来实现
 <dependency>
    <groupId>com.taobao.arthas</groupId>
    <artifactId>arthas-spring-boot-starter</artifactId>
    <version>3.5.4</version>
</dependency>
加入yaml 配置:
spring:
  arthas:
    enabled: true
arthas:
  ip: 127.0.0.1
  telnet-port: 3658
  app-name: ${spring.application.name}
  tunnel-server: ws://127.0.0.1:7777/ws
  agent-id: hsehdfsfghhwertyfad
  session-timeout: 1800
  http-port: 8563
通过: http://127.0.0.1:3658/ 访问的arthas 页面, 可以连接到arthas的命令行
日志会显示: Arthas agent start success. 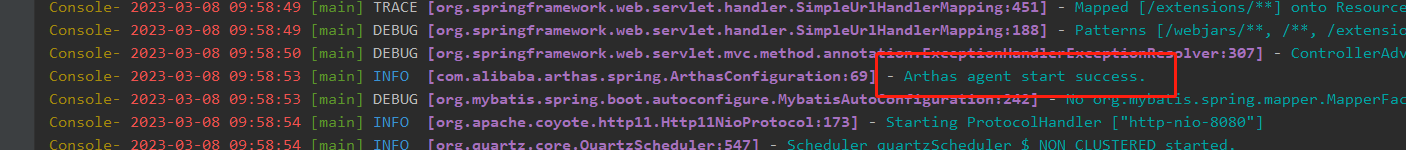
非Spring boot 的项目集成Arthas
spring 项目的接入文档链接地址
spring boot starter 的使用
xxx-spring-boot-starter 非官方的starter 从arthas-spring-boot-starter 学习starter的写法和使用
演示命令
arthas command link 链接地址
-
watch: 对方法的返回就行监控
watch com.example.study.controller.TestController testSpringBug ‘{params,returnObj,throwExp}’ -n 5 -x 3
启动项目调用 http://localhost:8080/testBug -
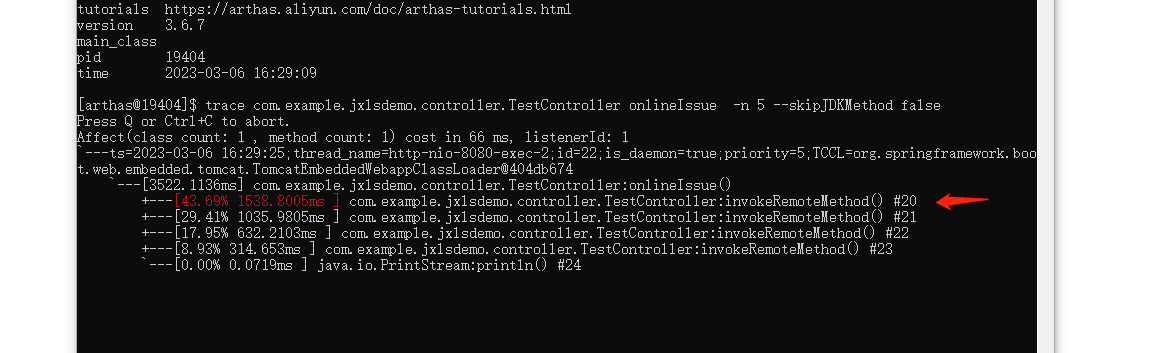
trace: 监控项目最耗时间的方法 , 对代码进行调优, 结合accor shop proxy 的优化
trace com.example.study.controller.TestController testSpringBug -n 5 –skipJDKMethod false
启动项目调用 http://localhost:8080/testBug -
stack: 方法的调用栈, 类似error 的异常堆栈,显示调用链
stack com.example.study.controller.TestController testSpringBug -n 5
启动项目调用 http://localhost:8080/testBug -
tt: 统计方法调用每次的调用时间
tt -t com.example.study.controller.TestController testSpringBug -n 5
启动项目调用 http://localhost:8080/testBug
Arthas 火焰图
https://arthas.aliyun.com/doc/profiler.html
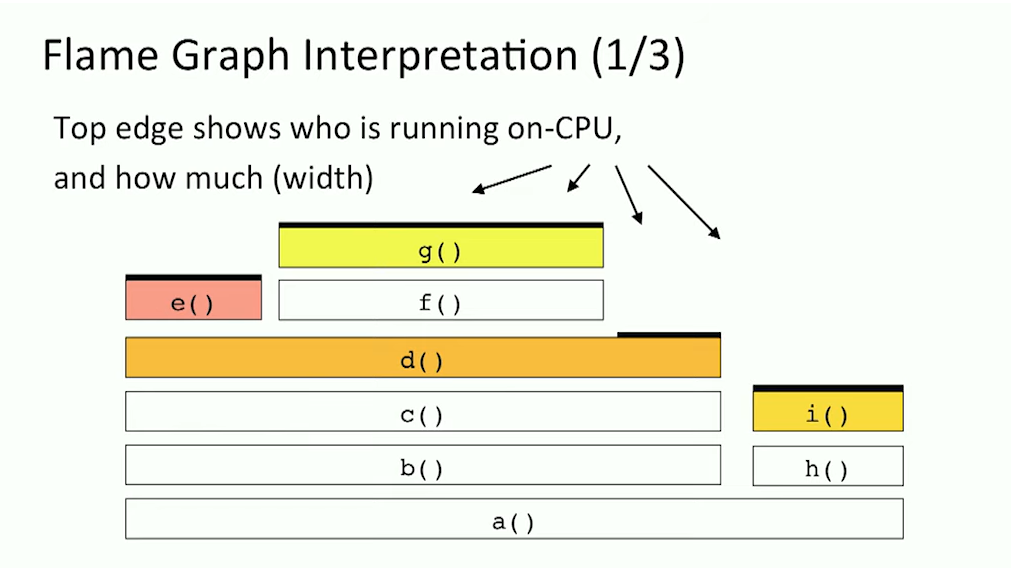
颜色本身没有什么意义 纵向表示调用栈的深度 横向表示消耗的时间
Flame Graphs 官网
cup allocate wall-clock
-
每一列代表一个调用栈,每一个格子代表一个函数
-
纵轴展示了栈的深度,按照调用关系从下到上排列。最顶上格子代表采样时,正在占用 cpu 的函数。
-
横轴的意义是指:火焰图将采集的多个调用栈信息,通过按字母横向排序的方式将众多信息聚合在一起。需要注意的是它并不代表时间。
-
横轴格子的宽度代表其在采样中出现频率,所以一个格子的宽度越大,说明它是瓶颈原因的可能性就越大
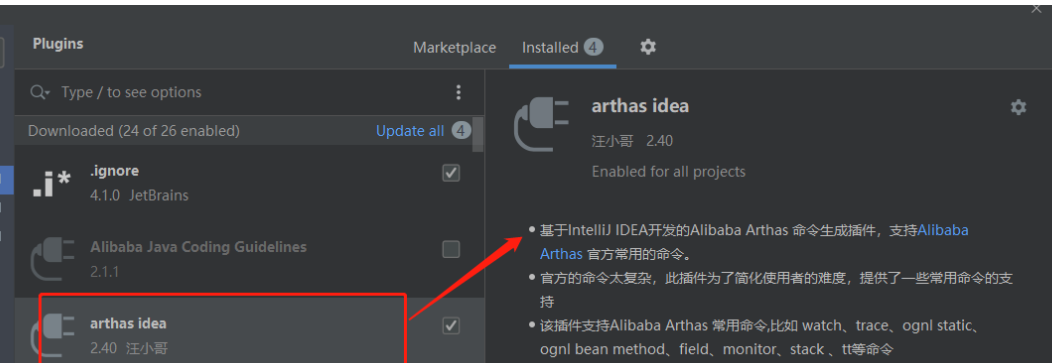
Arthas Idea 插件介绍
idea 插件连接 链接地址
Arthas 启动原理
- arthas-spring-boot-starter: 是 spring-boot 和arthas 自动配置的桥梁
- arthas-packaging: 包含了arthas运行的核心内容包(arthas-core!!!!!!)
- arthas-agent-attach: 加载arthas-packaging 里面的 一些核心类的逻辑封装
jar 的依赖 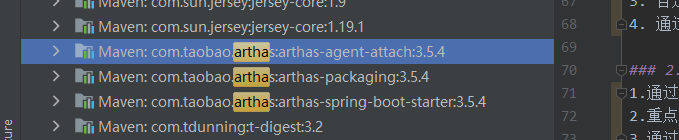
1. Spring boot 完成自动配置
spring 的自动配置会加载到启动配置类ArthasConfiguration 来完成 ArthasAgent bean 的创建
- 加载Spy, 看看是否arthas已经正在运行
- 下载arthas的安装包解压 (arthas-packaging 的jar包, 包含arthas-bin.zip压缩包)
- 自定义的类加载器(AttachArthasClassloader extends URLClassLoader) 加载一个ArthasBootstrap的启动类
- 反射调用方法 ArthasBootstrap getInstance(Instrumentation instrumentation, Map<String, String> args) 来创建 arthasBootstrap
理解ArthasBootstrap bind 方法的逻辑
shellServer
workerGroup
HttpTermServer or HttpTelnetTermServer
NettyHttpTelnetTtyBootstrap bootstrap –>start 创建了netty 的bossGroup, workerGroup netty-rpc
HttpRequestHandler 来回复用户发起的命令请求, 执行用户命令的处理器, 通过观察handler列表, 使用了WebSocket
创建JobImpl 来封装要执行的命令 ==> ArthasBootstrap.getInstance().execute(task)
BuiltinCommandPack 封装了所有的内部Command, 例如WatchCommand - 通过调用isBind 来判断是否绑定成功
- 通过命令行收集输入的命令:JobControllerImpl#createProcess
2.ArthasBootstrap 绑定
1.通过bind 方法来完成绑定;
2.重点是创建了netty 的服务端来来完成Tcp or Http 的通讯
3.通过Reactor模型来接收和分发处理连接,请求命令的处理
cmd 的方式启动流程
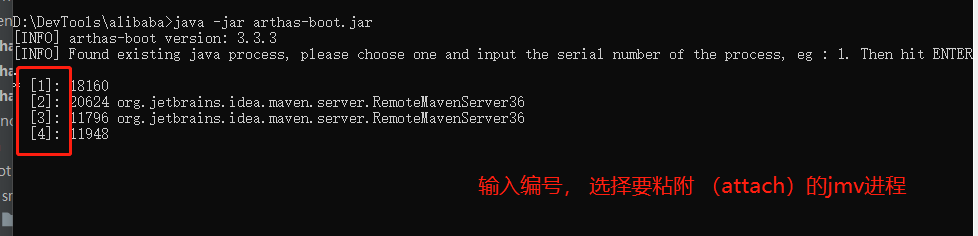
执行命令: java -jar arthas-boot.jar 来启动本地arthas 服务
1.arthas-agent 模块的AgentBootstrap 完成bind
2.arthas-core 模块的 ArthasBootstrap 来完成和用户的交互
command.addAll(attachArgs);

// 命令行启动后, 会被解析的shell 脚本如下
// 从注释的细节可以看出底层调用了那些模块, 大胆推断大概的运行原理

// "${JAVA_HOME}"/bin/java \
// ${opts} \
// -jar "${arthas_lib_dir}/arthas-core.jar" \
// -pid ${TARGET_PID} \
// -target-ip ${TARGET_IP} \
// -telnet-port ${TELNET_PORT} \
// -http-port ${HTTP_PORT} \
// -core "${arthas_lib_dir}/arthas-core.jar" \
// -agent "${arthas_lib_dir}/arthas-agent.jar"
3.调用arthas-core 包的Arthas类运行启动, 读取命令行, 构建Configure
4.arthas-core ArthasBootstrap 会启动一个基于netty的服务端 (tcp)
Arthas 在线诊断
诊断耗时长的原因;