页面的结构
<!DOCTYPE html>
<html style="height: 100%">
<head>
    <meta charset="utf-8">
</head>
<body style="height: 100%; margin: 0">
<div id="container" style="height: 100%"></div>
<script type="text/javascript" src="http://echarts.baidu.com/gallery/vendors/echarts/echarts.min.js"></script>
<script type="text/javascript">
    //TODO  插入对应的节点
</script>
</body>
</html>
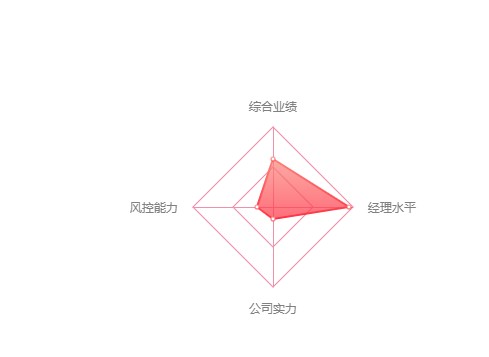
雷达图
var dom = document.getElementById("container");
var myChart = echarts.init(dom);
option = {
title : {
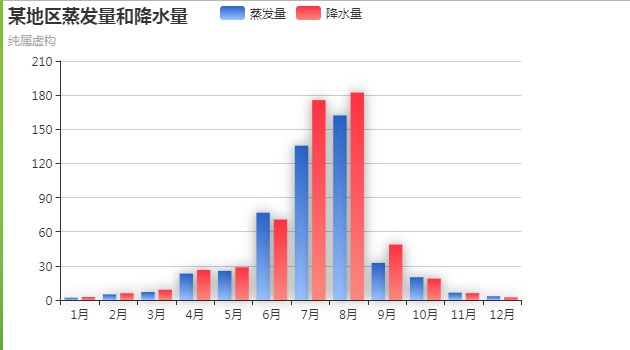
text: '某地区蒸发量和降水量',
subtext: '纯属虚构'
},
tooltip : {
trigger: 'axis'
},
legend: {
data:['蒸发量','降水量']
},
xAxis : [
{
type : 'category',
data : ['1月','2月','3月','4月','5月','6月','7月','8月','9月','10月','11月','12月']
}
],
yAxis : [
{
type : 'value'
}
],
series : [
{
name:'蒸发量',
type:'bar',
itemStyle: {
normal: {
//由上到下的渐变
color: new echarts.graphic.LinearGradient(0, 0, 0, 1, [{
offset: 0,
color: '#2864C8'
}, {
offset: 1,
color: '#9AC2FF'
}]),
shadowColor: 'rgba(0, 0, 0, 0.4)',
shadowBlur: 20
}
},
data:[2.0, 4.9, 7.0, 23.2, 25.6, 76.7, 135.6, 162.2, 32.6, 20.0, 6.4, 3.3]
},
{
name:'降水量',
type:'bar',
itemStyle: {
normal: {
//由上到下的渐变
color: new echarts.graphic.LinearGradient(0, 0, 0, 1, [{
offset: 0,
color: '#FF3042'
}, {
offset: 1,
color: '#FA887E'
}]),
shadowColor: 'rgba(0, 0, 0, 0.4)',
shadowBlur: 20
},
emphasis:{
color: new echarts.graphic.LinearGradient(0, 1, 0, 0, [{
offset: 0,
color: '#FF3042'
}, {
offset: 1,
color: '#FA887E'
}])
}
},
data:[2.6, 5.9, 9.0, 26.4, 28.7, 70.7, 175.6, 182.2, 48.7, 18.8, 6.0, 2.3],
}
]};
if (option && typeof option === "object") {
myChart.setOption(option, true);
}
折线图
var dom = document.getElementById("container");
var myChart = echarts.init(dom);
var option = {
title : {
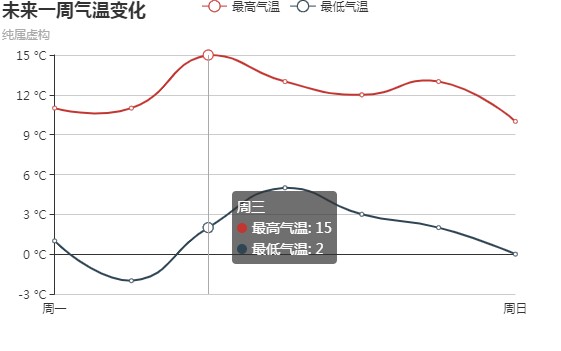
text: '未来一周气温变化',
subtext: '纯属虚构'
},
tooltip : {
trigger: 'axis'
},
legend: {
data:['最高气温','最低气温']
},
xAxis : [
{
type : 'category',
boundaryGap : false,
data : ['周一','周二','周三','周四','周五','周六','周日'],
axisLabel:{
formatter: function (value, index) {
if(index ==0 || index == 6){
return value;
}
}
},
axisTick:{
show:false
},
},
],
yAxis : [
{
type : 'value',
axisLabel : {
formatter: '{value} °C'
}
}
],
series : [
{
name:'最高气温',
type:'line',
data:[11, 11, 15, 13, 12, 13, 10],
smooth:true
},
{
name:'最低气温',
type:'line',
data:[1, -2, 2, 5, 3, 2, 0],
smooth:true
}
]
};
if (option && typeof option === "object") {
myChart.setOption(option, true);
}
柱状图
 var dom = document.getElementById("container");
    var myChart = echarts.init(dom);
    option = {
        title : {
            text: '某地区蒸发量和降水量',
            subtext: '纯属虚构'
        },
        tooltip : {
            trigger: 'axis'
        },
        legend: {
            data:['蒸发量','降水量']
        },
        xAxis : [
            {
                type : 'category',
                data : ['1月','2月','3月','4月','5月','6月','7月','8月','9月','10月','11月','12月']
            }
        ],
        yAxis : [
            {
                type : 'value'
            }
        ],
        series : [
            {
                name:'蒸发量',
                type:'bar',
                itemStyle: {
                    normal: {
                        //由上到下的渐变
                        color: new echarts.graphic.LinearGradient(0, 0, 0, 1, [{
                            offset: 0,
                            color: '#2864C8'
                        }, {
                            offset: 1,
                            color: '#9AC2FF'
                        }]),
                        shadowColor: 'rgba(0, 0, 0, 0.4)',
                        shadowBlur: 20
                    }
                },
                data:[2.0, 4.9, 7.0, 23.2, 25.6, 76.7, 135.6, 162.2, 32.6, 20.0, 6.4, 3.3]
            },
            {
                name:'降水量',
                type:'bar',
                itemStyle: {
                    normal: {
                        //由上到下的渐变
                        color: new echarts.graphic.LinearGradient(0, 0, 0, 1, [{
                            offset: 0,
                            color: '#FF3042'
                        }, {
                            offset: 1,
                            color: '#FA887E'
                        }]),
                        shadowColor: 'rgba(0, 0, 0, 0.4)',
                        shadowBlur: 20
                    },

                    //鼠标悬浮的颜色效果-渐变的
                    emphasis:{
                        color: new echarts.graphic.LinearGradient(0, 1, 0, 0, [{
                            offset: 0,
                            color: '#FF3042'
                        }, {
                            offset: 1,
                            color: '#FA887E'
                        }])
                    }

                },
                data:[2.6, 5.9, 9.0, 26.4, 28.7, 70.7, 175.6, 182.2, 48.7, 18.8, 6.0, 2.3],
            }
        ]
    };

    if (option && typeof option === "object") {
        myChart.setOption(option, true);
    }
效果如下
雷达图
折线图
柱状图