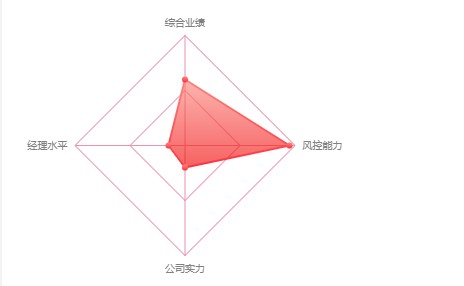
雷达图
<!DOCTYPE html>
<html lang="en">
<head>
    <meta charset="UTF-8">
    <meta name="viewport" content="width=device-width, initial-scale=1.0, user-scalable=no">
    <meta name="chart-name" content="基金评估">
    <title>F2 图表组件库 - AntV</title>
    <!--<link rel="stylesheet" href="https://gw.alipayobjects.com/os/rmsportal/YmDAMEQVbLJpVbKiRQVX.css"/>-->

</head>
<body>
<script src="https://gw.alipayobjects.com/os/antv/assets/f2/3.3.0/f2.min.js"></script>
<div class="chart-wrapper">
    <canvas id="mountNode"></canvas>
</div>
<script>

    F2.track(true);      // 开启打点监控
    F2.Global.setTheme({
        colors: [ '#F04864', '#D66BCA', '#8543E0', '#8E77ED', '#3436C7', '#737EE6', '#223273', '#7EA2E6' ],
        pixelRatio: 2,
        guide: {
            line: {
                stroke: '#F04864',
                lineWidth: 2,
                color:'#F04864',
                fill: 'r(0.5,0.5,0.1) 0:#ffffff 1:#1890ff'
            }
        }
    });
    var chart = new F2.Chart({
        id: 'mountNode',
        width: 350,
        height: 300,
        //appendPaddign:'auto',
        //padding: [ 12, 10, 10, 10 ], // 分别设置上、右、下、左边距
        pixelRatio: window.devicePixelRatio
    });

    chart.source([{
        name: '综合业绩',
        value: 60
    }, {
        name: '风控能力',
        value: 95
    }, {
        name: '公司实力',
        value: 20
    }, {
        name: '经理水平',
        value: 15
    }], {
        value: {
            min: 0,
            max: 100,
            tickCount: 3,
            fill: 'r(0.5,0.5,0.1) 0:#ffffff 1:#1890ff',
            stroke: '#F04864',

        }
    });
    //https://www.yuque.com/antv/f2/api-axis
    chart.coord('polar');
    chart.tooltip(true); // 关闭 tooltip
    chart.axis('value', {
        grid: {
            lineDash: null,
            stroke: '#ef91ab'
        },
        label: null,
        line: null
    });
    chart.axis('name', {
        grid: {
            lineDash: null,
            stroke: '#ef91ab'
        }
    });
    chart.area().position('name*value').color('l(-90) 0:#F00000 1:#FA887E').style({
        fillOpacity: 0.618
    }).animate({
        appear: {
            animation: 'groupWaveIn'
        }
    });
    chart.line().position('name*value').color('l(-90) 0:#FF3042 1:#FA887E').style({
        fillOpacity: 0.6
    }).animate({
        appear: {
            animation: 'groupWaveIn'
        }
    });
    chart.point().position('name*value').color('l(-90) 0:#FF3042 1:#FA887E').animate({
        appear: {
            delay: 300
        }
    });
    chart.guide().html({
        position: ['50%', '50%'],
        html: '<div></div>'
    });
    chart.render();

</script>


</body>
</html>
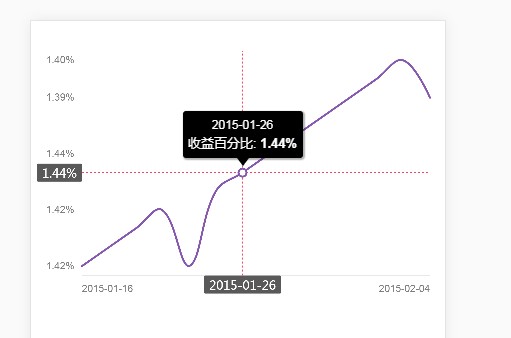
折线图
<!DOCTYPE html>
<html lang="en">
<head>
    <meta charset="UTF-8">
    <meta name="viewport" content="width=device-width, initial-scale=1.0, user-scalable=no">
    <meta name="chart-name" content="时序折线图过渡动画">
    <title>F2 图表组件库 - AntV</title>
    <link rel="stylesheet" href="https://gw.alipayobjects.com/os/rmsportal/YmDAMEQVbLJpVbKiRQVX.css"/>

</head>
<body>

<script src="https://gw.alipayobjects.com/os/antv/assets/f2/3.3.0/f2.min.js"></script>
<style>
    .chart-wrapper {
        position: relative;
    }

    .f2-tooltip {
        -moz-box-shadow: 1px 1px 0.5px 0.5px rgba(0, 0, 0, 0.3);
        -webkit-box-shadow: 1px 1px 0.5px 0.5px rgba(0, 0, 0, 0.3);
        box-shadow: 1px 1px 0.5px 0.5px rgba(0, 0, 0, 0.3);
        position: absolute;
        z-index: 99;
        background-color: #000;
        padding: 5px;
        border-radius: 3px;
        text-align: center;
        width: 120px;
        opacity: 0;
    }

    .f2-tooltip:after {
        content: " ";
        width: 0;
        height: 0;
        border-left: 6px solid transparent;
        border-right: 6px solid transparent;
        border-top: 8px solid #000;
        position: absolute;
        left: 50%;
        margin-left: -6px;
        bottom: -8px;
    }

    .f2-tooltip span {
        display: block;
        color: #fff;
    }

    .f2-tooltip span:nth-child(1) {
        font-size: 11px !important;
    }

    .f2-tooltip span:nth-child(2) {
        font-size: 13px !important;
    }
</style>

<div class="chart-wrapper">
    <canvas id="mountNode"></canvas>
</div>
<script>

    var data = [
        {"reportDate": "2015-01-16", "value": "1.42", "reportDateTimestamp": 1421337600000},
        {"reportDate": "2015-01-19", "value": "1.34", "reportDateTimestamp": 1421596800000},
        {"reportDate": "2015-01-20", "value": "1.372", "reportDateTimestamp": 1421683200000},
        {"reportDate": "2015-01-21", "value": "1.417", "reportDateTimestamp": 1421769600000},
        {"reportDate": "2015-01-22", "value": "1.42", "reportDateTimestamp": 1421856000000},
        {"reportDate": "2015-01-23", "value": "1.424", "reportDateTimestamp": 1421942400000},
        {"reportDate": "2015-01-26", "value": "1.442", "reportDateTimestamp": 1422201600000},
        {"reportDate": "2015-01-27", "value": "1.435", "reportDateTimestamp": 1422288000000},
        {"reportDate": "2015-01-28", "value": "1.419", "reportDateTimestamp": 1422374400000},
        {"reportDate": "2015-01-29", "value": "1.405", "reportDateTimestamp": 1422460800000},
        {"reportDate": "2015-01-30", "value": "1.390", "reportDateTimestamp": 1422547200000},
        {"reportDate": "2015-02-02", "value": "1.373", "reportDateTimestamp": 1422806400000},
        {"reportDate": "2015-02-03", "value": "1.399", "reportDateTimestamp": 1422892800000},
        {"reportDate": "2015-02-04", "value": "1.390", "reportDateTimestamp": 1422979200000}]
    chart = new F2.Chart({
        id: 'mountNode',
        pixelRatio: window.devicePixelRatio
    });

    var dom = document.getElementById('mountNode');
    var canvasOffsetTop = dom.clientTop;
    var canvasOffsetLeft = dom.clientLeft;

    chart.source(data, {
        reportDateTimestamp: {
            type: 'timeCat',
            tickCount: 2,
            range: [0, 1],
        },
        value: {
            alias: '涨幅',
            tickCount: 5,
            formatter: function formatter(val) {
                return parseFloat(val).toFixed(2) + '%';
            }
        }
    });

    //自定义tooltip 参考了
    // https://www.yuque.com/antv/f2/tooltip
    //https://antv.alipay.com/zh-cn/f2/3.x/demo/component/tooltip-custom.html
    chart.tooltip({
        custom: true,
        showXTip: true,
        showYTip: true,
        snap: true,
        crosshairsType: 'xy',
        crosshairsStyle: {
            lineDash: [2],
            stroke: '#F04864',
        },
        onChange: function onChange(ev) {
            var doms = document.getElementsByClassName('f2-tooltip');
            var tooltipEl = null;
            if (null == doms || doms.length == 0) {
                tooltipEl = document.createElement('div');
            } else {
                tooltipEl = doms[0];
            }
            tooltipEl.className = 'f2-tooltip';
            var currentData = ev.items[0];
            var text = currentData.value;
            tooltipEl.innerHTML = (['<span>' + currentData.origin.reportDate + '</span>', '<span>' + '收益百分比: <b>' + text + '</b></span>'].join(''));
            tooltipEl.style.opacity = 1;
            tooltipEl.style.left = canvasOffsetLeft + currentData.x - tooltipEl.clientWidth / 2 + 'px';
            tooltipEl.style.top = canvasOffsetTop + currentData.y - tooltipEl.clientHeight - 15 + 'px';
            document.getElementsByClassName('chart-wrapper')[0].appendChild(tooltipEl)
        },
        onHide: function onHide() {
            var tooltipEl = document.getElementsByClassName('f2-tooltip')[0];
            tooltipEl.style.opacity = 0;
        }
    });
    chart.axis('reportDateTimestamp', {
        label: function label(text, index, total) {
            var cfg = {};
            if (index === 0) {
                cfg.textAlign = 'start';
                return cfg;
            }
            if (index > 0 && index === total - 1) {
                cfg.textAlign = 'end';
                return cfg;
            }
        }
    });

    chart.axis('value',{
        grid: {
            lineDash: null,
            stroke: '#fff',
            lineWidth: 1
        }
    });

    chart.line().color('#8659AF').shape('smooth').position('reportDateTimestamp*value');

    //加入渐变的颜色
//    chart.line({
//        sortable: false
//    }).color('l(0) 0:#F2C587 0.5:#ED7973 1:#8659AF').position('reportDateTimestamp*value').shape('smooth').animate({
//        update: {
//            animation: 'lineUpdate'
//        }
//    });
//    chart.area({
//        sortable: false
//    }).color('l(0) 0:#F2C587 0.5:#ED7973 1:#8659AF').position('reportDateTimestamp*value').shape('smooth').animate({
//        update: {
//            animation: 'lineUpdate'
//        }
//    });
    chart.render();
</script>


</body>
</html>
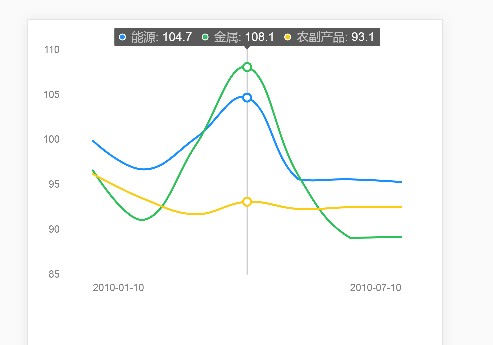
折线图(多根线)
<!DOCTYPE html>
<html lang="en">
<head>
<meta charset="UTF-8">
<meta name="viewport" content="width=device-width, initial-scale=1.0, user-scalable=no">
<meta name="chart-name" content="商品价格 7 年走势对比">
<title>F2 图表组件库 - AntV</title>
<link rel="stylesheet" href="https://gw.alipayobjects.com/os/rmsportal/YmDAMEQVbLJpVbKiRQVX.css" />
</head>
<body>
<script>/*Fixing iframe window.innerHeight 0 issue in Safari*/document.body.clientHeight;</script>
<script src="https://gw.alipayobjects.com/os/antv/assets/f2/3.3.0/f2.min.js"></script>
<!--<script src="https://gw.alipayobjects.com/os/antv/assets/lib/lodash-4.17.4.min.js"></script>-->
<!--<script src="https://gw.alipayobjects.com/os/antv/assets/lib/jquery-3.2.1.min.js"></script>-->
<!--<!– 在 PC 上模拟 touch 事件 –>-->
<!--<script src="https://gw.alipayobjects.com/os/rmsportal/NjNldKHIVQRozfbAOJUW.js"></script>-->
<div class="chart-wrapper">
<canvas id="mountNode"></canvas>
</div>
<script>
var data = [
{"date":"2010-01-10","type":"能源","value":99.9},
{"date":"2010-01-10","type":"金属","value":96.6},
{"date":"2010-01-10","type":"农副产品","value":96.2},
{"date":"2010-02-10","type":"能源","value":96.7},
{"date":"2010-02-10","type":"金属","value":91.1},
{"date":"2010-02-10","type":"农副产品","value":93.4},
{"date":"2010-03-10","type":"能源","value":100.2},
{"date":"2010-03-10","type":"金属","value":99.4},
{"date":"2010-03-10","type":"农副产品","value":91.7},
{"date":"2010-04-10","type":"能源","value":104.7},
{"date":"2010-04-10","type":"金属","value":108.1},
{"date":"2010-04-10","type":"农副产品","value":93.1},
{"date":"2010-05-10","type":"能源","value":95.6},
{"date":"2010-05-10","type":"金属","value":96},
{"date":"2010-05-10","type":"农副产品","value":92.3},
{"date":"2010-06-10","type":"能源","value":95.6},
{"date":"2010-06-10","type":"金属","value":89.1},
{"date":"2010-06-10","type":"农副产品","value":92.5},
{"date":"2010-07-10","type":"能源","value":95.3},
{"date":"2010-07-10","type":"农副产品","value":92.5},
{"date":"2010-07-10","type":"金属","value":89.2}];
var chart = new F2.Chart({
id: 'mountNode',
pixelRatio: window.devicePixelRatio
});
chart.source(data);
chart.scale('date', {
type: 'timeCat',
tickCount: 2
});
chart.scale('value', {
tickCount: 5
});
chart.axis('date', {
label: function label(text, index, total) {
// 只显示每一年的第一天
var textCfg = {};
if (index === 0) {
textCfg.textAlign = 'left';
return textCfg;
} else if (index === total - 1) {
textCfg.textAlign = 'right';
return textCfg;
}
}
});
chart.axis('value', {
grid: {
lineDash: null,
stroke: '#fff',
lineWidth: 1
}
});
chart.legend(false);
chart.line().shape('smooth').position('date*value').color('type');
chart.render();
</script>
</body>
</html>
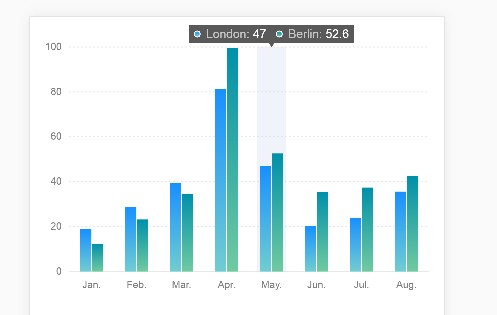
条形图
<!DOCTYPE html>
<html lang="en">
<head>
    <meta charset="UTF-8">
    <meta name="viewport" content="width=device-width, initial-scale=1.0, user-scalable=no">
    <meta name="chart-name" content="分组柱状图">
    <title>F2 图表组件库 - AntV</title>
    <link rel="stylesheet" href="https://gw.alipayobjects.com/os/rmsportal/YmDAMEQVbLJpVbKiRQVX.css"/>

</head>
<body>

<script src="https://gw.alipayobjects.com/os/antv/assets/f2/3.3.0/f2.min.js"></script>

<div class="chart-wrapper">
    <canvas id="mountNode"></canvas>
</div>
<script>
    var data = [{
        name: 'London',
        月份: 'Jan.',
        月均降雨量: 18.9
    }, {
        name: 'London',
        月份: 'Feb.',
        月均降雨量: 28.8
    }, {
        name: 'London',
        月份: 'Mar.',
        月均降雨量: 39.3
    }, {
        name: 'London',
        月份: 'Apr.',
        月均降雨量: 81.4
    }, {
        name: 'London',
        月份: 'May.',
        月均降雨量: 47
    }, {
        name: 'London',
        月份: 'Jun.',
        月均降雨量: 20.3
    }, {
        name: 'London',
        月份: 'Jul.',
        月均降雨量: 24
    }, {
        name: 'London',
        月份: 'Aug.',
        月均降雨量: 35.6
    }, {
        name: 'Berlin',
        月份: 'Jan.',
        月均降雨量: 12.4
    }, {
        name: 'Berlin',
        月份: 'Feb.',
        月均降雨量: 23.2
    }, {
        name: 'Berlin',
        月份: 'Mar.',
        月均降雨量: 34.5
    }, {
        name: 'Berlin',
        月份: 'Apr.',
        月均降雨量: 99.7
    }, {
        name: 'Berlin',
        月份: 'May.',
        月均降雨量: 52.6
    }, {
        name: 'Berlin',
        月份: 'Jun.',
        月均降雨量: 35.5
    }, {
        name: 'Berlin',
        月份: 'Jul.',
        月均降雨量: 37.4
    }, {
        name: 'Berlin',
        月份: 'Aug.',
        月均降雨量: 42.4
    }];
    var chart = new F2.Chart({
        id: 'mountNode',
        pixelRatio: window.devicePixelRatio
    });
    chart.source(data);
    chart.tooltip(true);
    chart.legend(false);


    chart.interval().position('月份*月均降雨量').color('name', ['l(90) 0:#1890ff 1:#70cdd0', 'l(90) 0:#0090aa 1:#70caa0'])
        .adjust({
            type: 'dodge',
            marginRatio: 0.05 // 设置分组间柱子的间距
        });
    chart.render();
</script>


</body>
</html>
效果如下
雷达图
折线图
柱状图